Income Statement
Accounting is the language of business.
If you buy stocks, you MUST learn how to read an income statement
Here’s everything you need to know:
The income statement shows a company’s revenue and expenses over a period of time.
It’s also called a Profit and Loss statement, or “P & L”
Periodicity and Availability:
The most common time periods are:
▪️1 Quarter / 90 days
▪️1 Year / 365 days
▪️TTM /“Trailing Twelve Months”
▪️YTD / “Year To Date”
Some companies report 6 months & 9 months, too. Companies usually show the income statement in the quarterly earnings press release, but not always
You can find them by looking at:
▪️quarterly report
▪️annual report
on Financial websites such as Screener , Moneycontrol or on Company's website there is a section for Shareholders or Investors Relations.
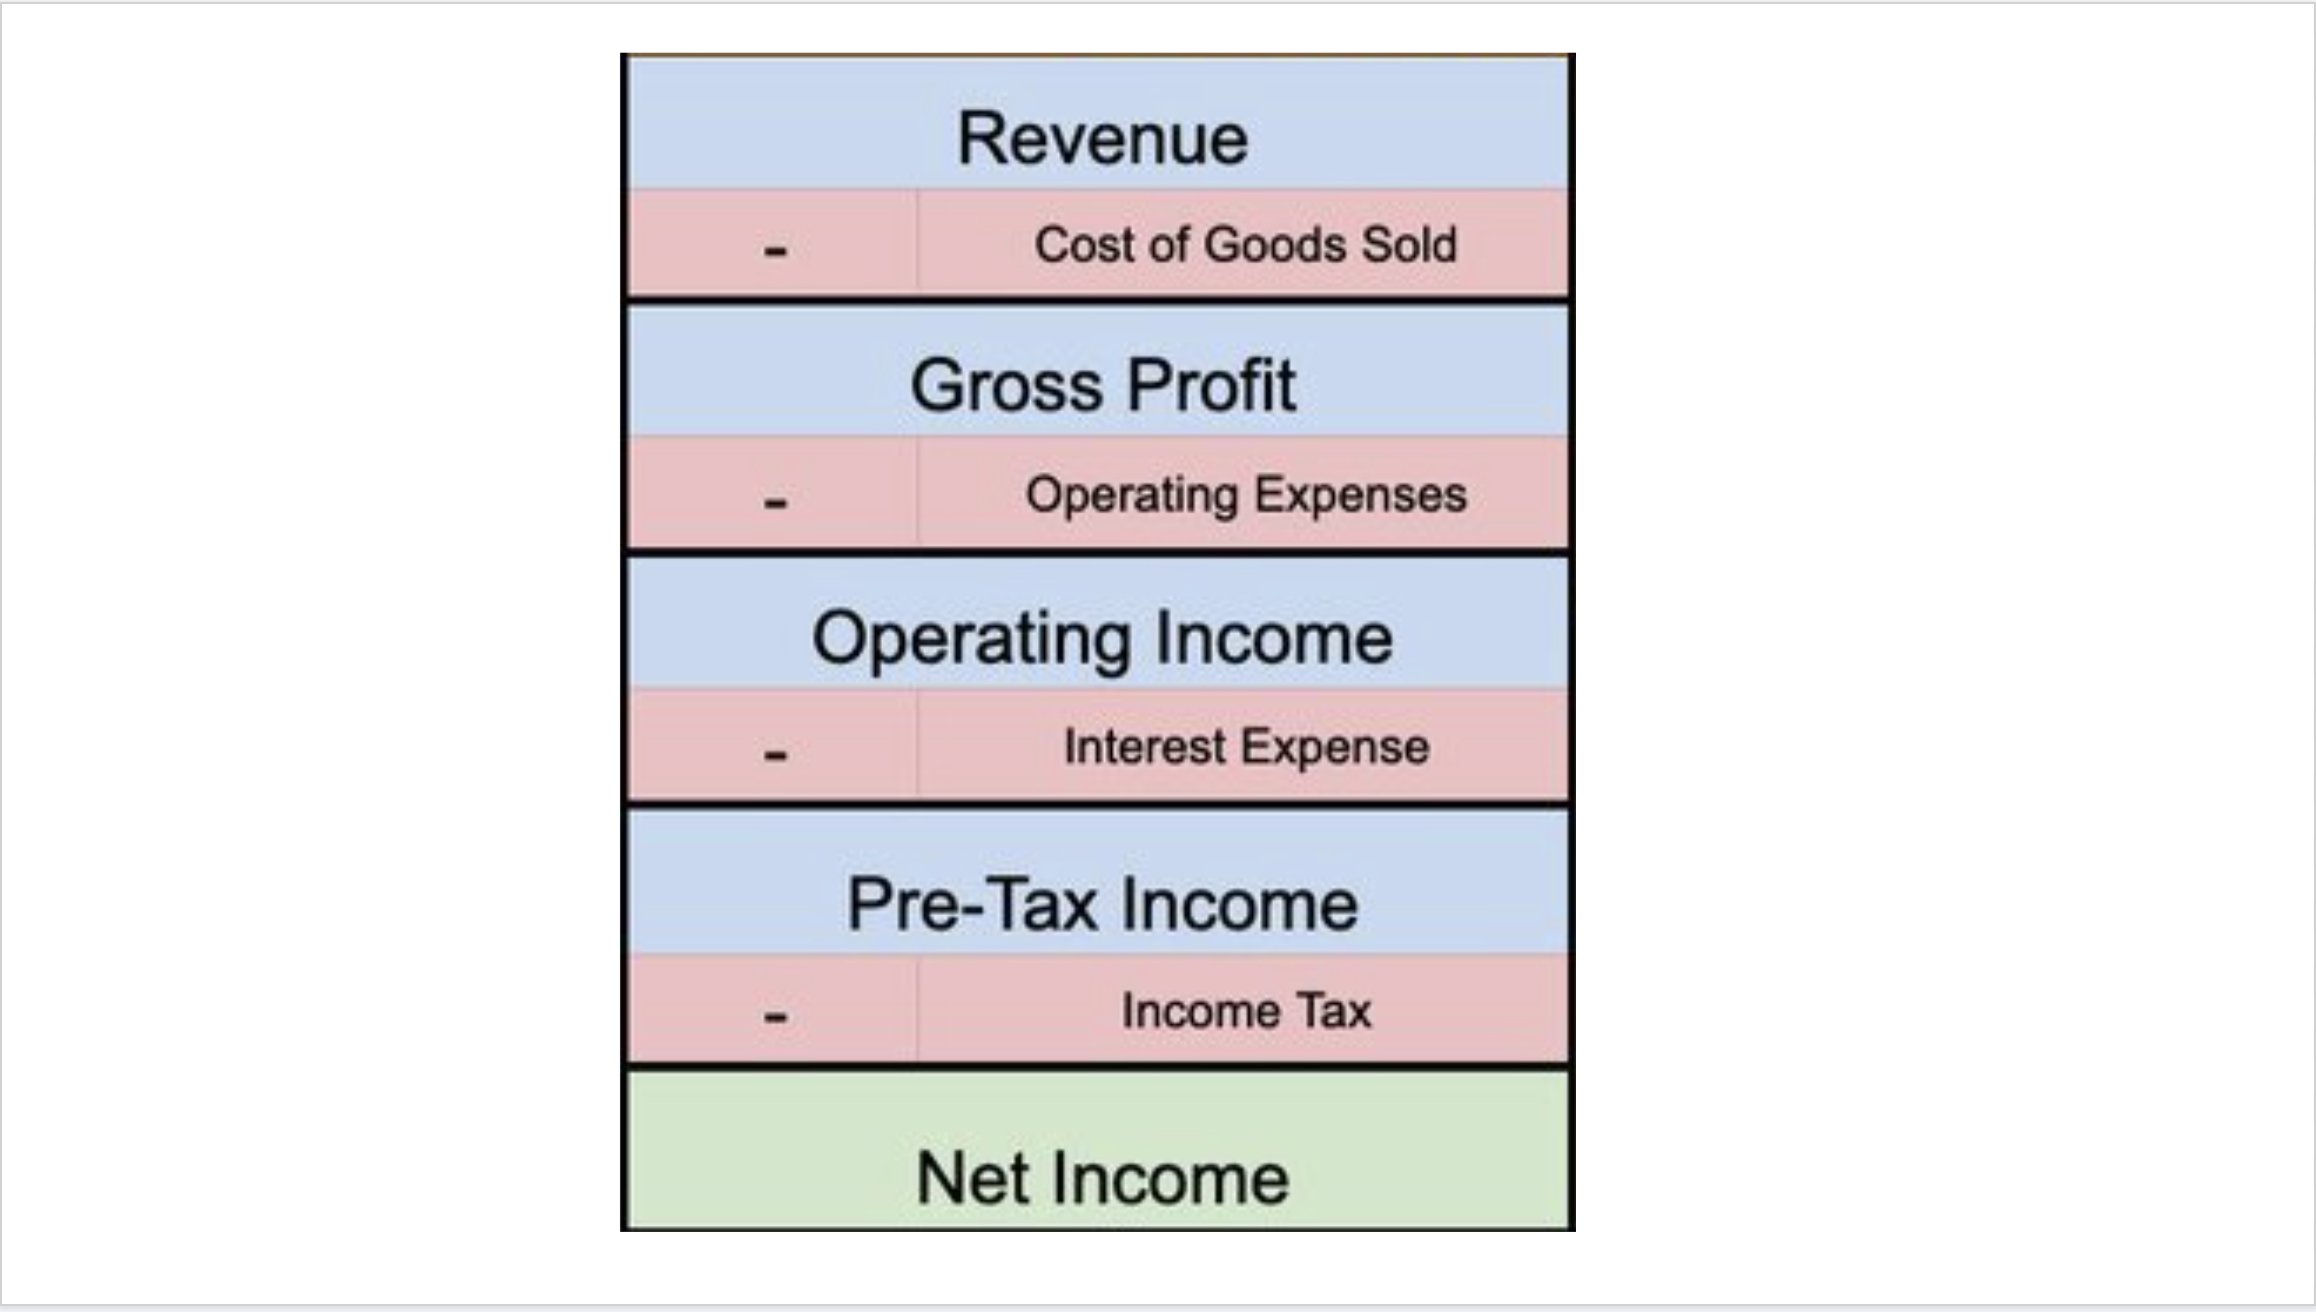 The income statement flows in a step-down manner.
The top number is revenue (sales) and costs are subtracted as you go down.
In the U.S., the income statement follows this basic format (there are exceptions)
Let's take them one at a time
1: Revenue
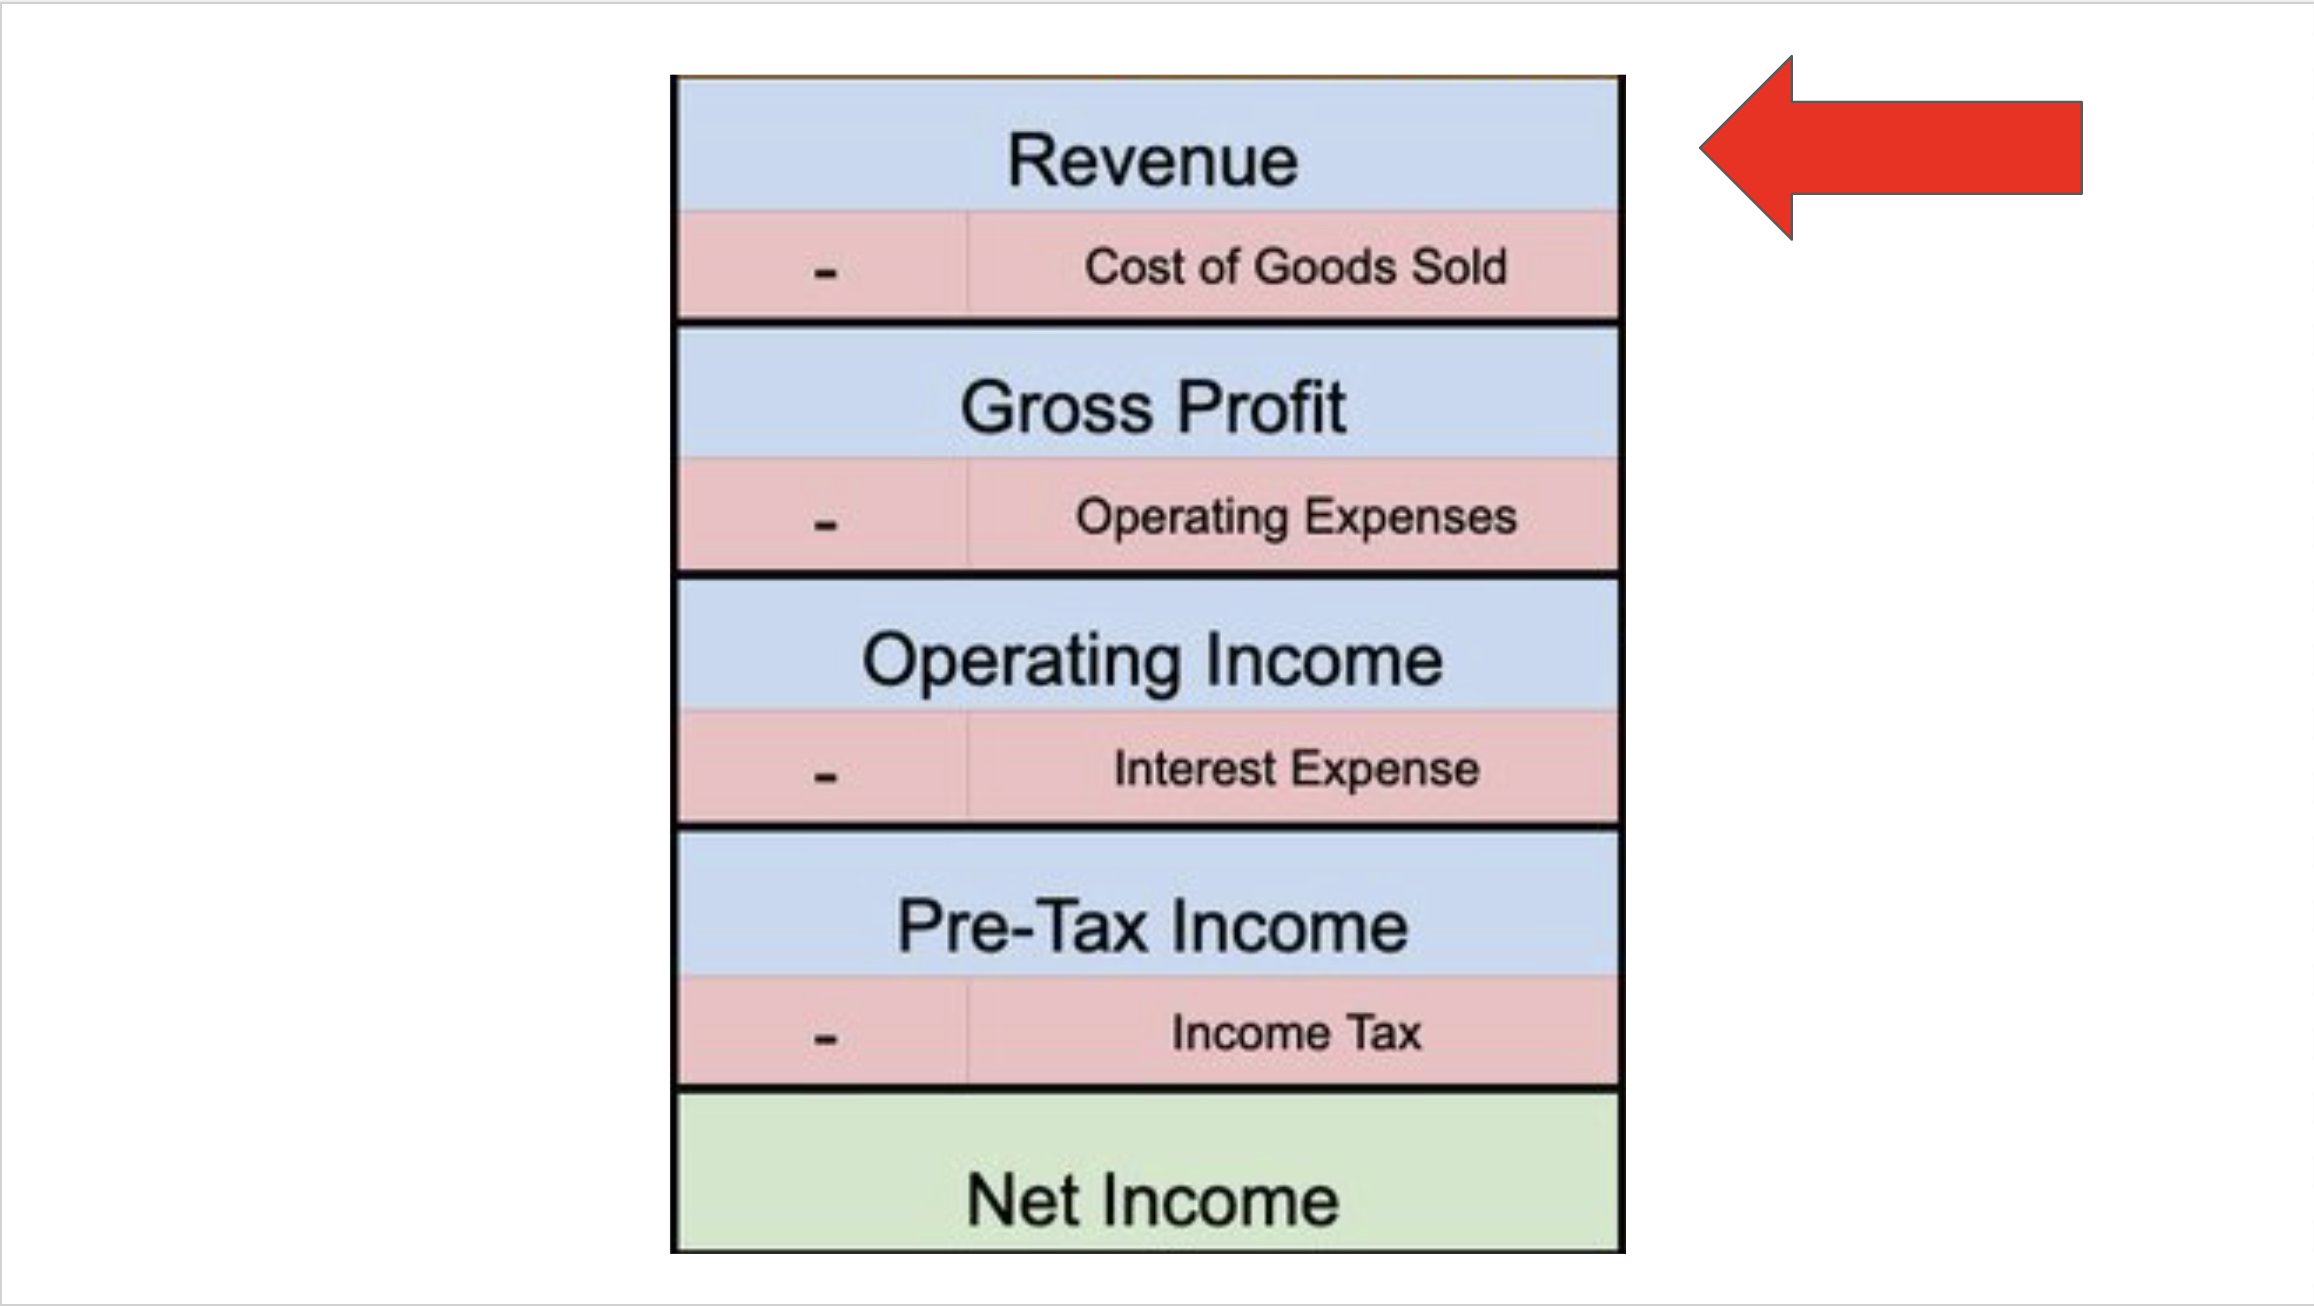 This is the amount received or to be received from the sales of products/services to customers during the period.
Sales revenue is net, meaning it includes discounts, returns, and any other deductions from the sales price. The more the company sells the products the more revenue it will generate and selling is dependent upon companys market capturing size , marketing policies, product quality and business strategies. Sales is byproduct of demands. Either it is already present or demand is created by manipulating the customers. Sometimes it is dependent upon situations of time and geography also.
2: Cost of Goods Sold (COGS)
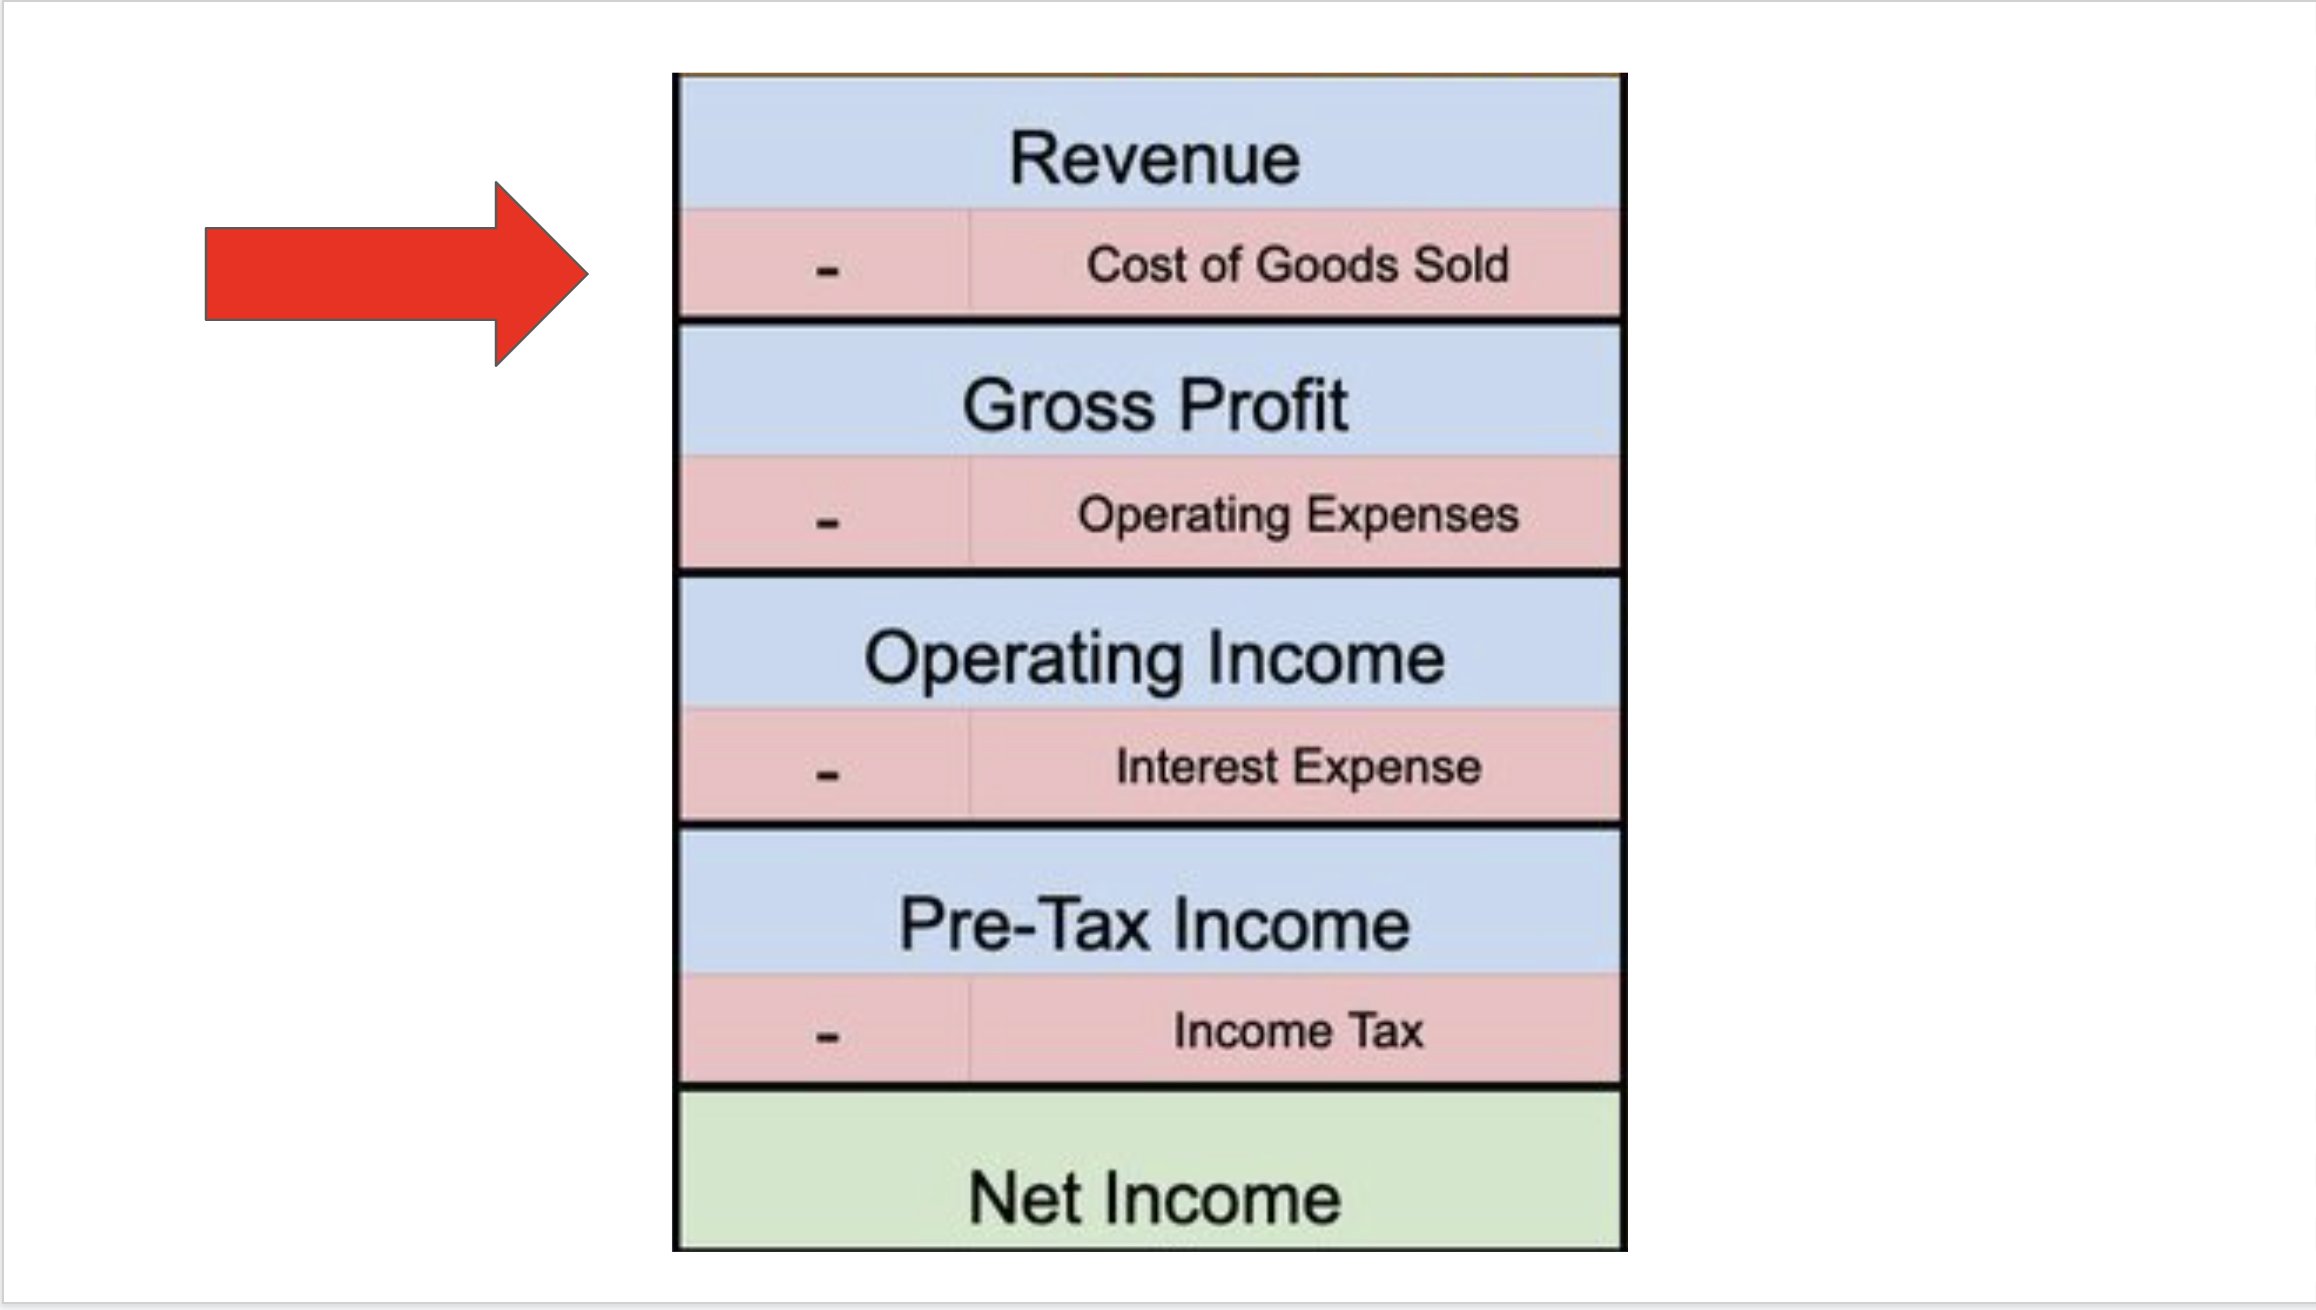 This figure shows all of the costs & expenses related to producing the product and/or service.
If you sell calculators, this would be the variable costs of:
▪️Chips
▪️Memory
▪️Plastic
▪️Labor costs
▪️Etc...
to manufacture the calculators.
Now the point is - lesser the cost incurred on product better will be revenues as due to cost cutting either company will benefit inwardly or outwardly as it will ramp up sales automatically due to cheaper prices and hence increasing sales.
3: Gross profit
This is Revenue - COGS
It is also called “gross income”.
 More the Revenues - More the Profits.
Revenues and Profits are not the Same. Revenues is what you get after selling all your products and when you deduct actuall cost of goods you get your gross profit.
For example, you made a pen.lets suppose the cost actual cost incurred in making the pen is 7rs and you sold it in 10rs. Now the 10 rs you get after selling is Revenue but when you deduct 7rs that is the cost of good you will get 3rs. this 3 rs is your Gross Profit.
Here you can understand that to increase your profits either you will have to cut the cost or you will have to increase the sales.
4a: Operating Expenses (OPEX)
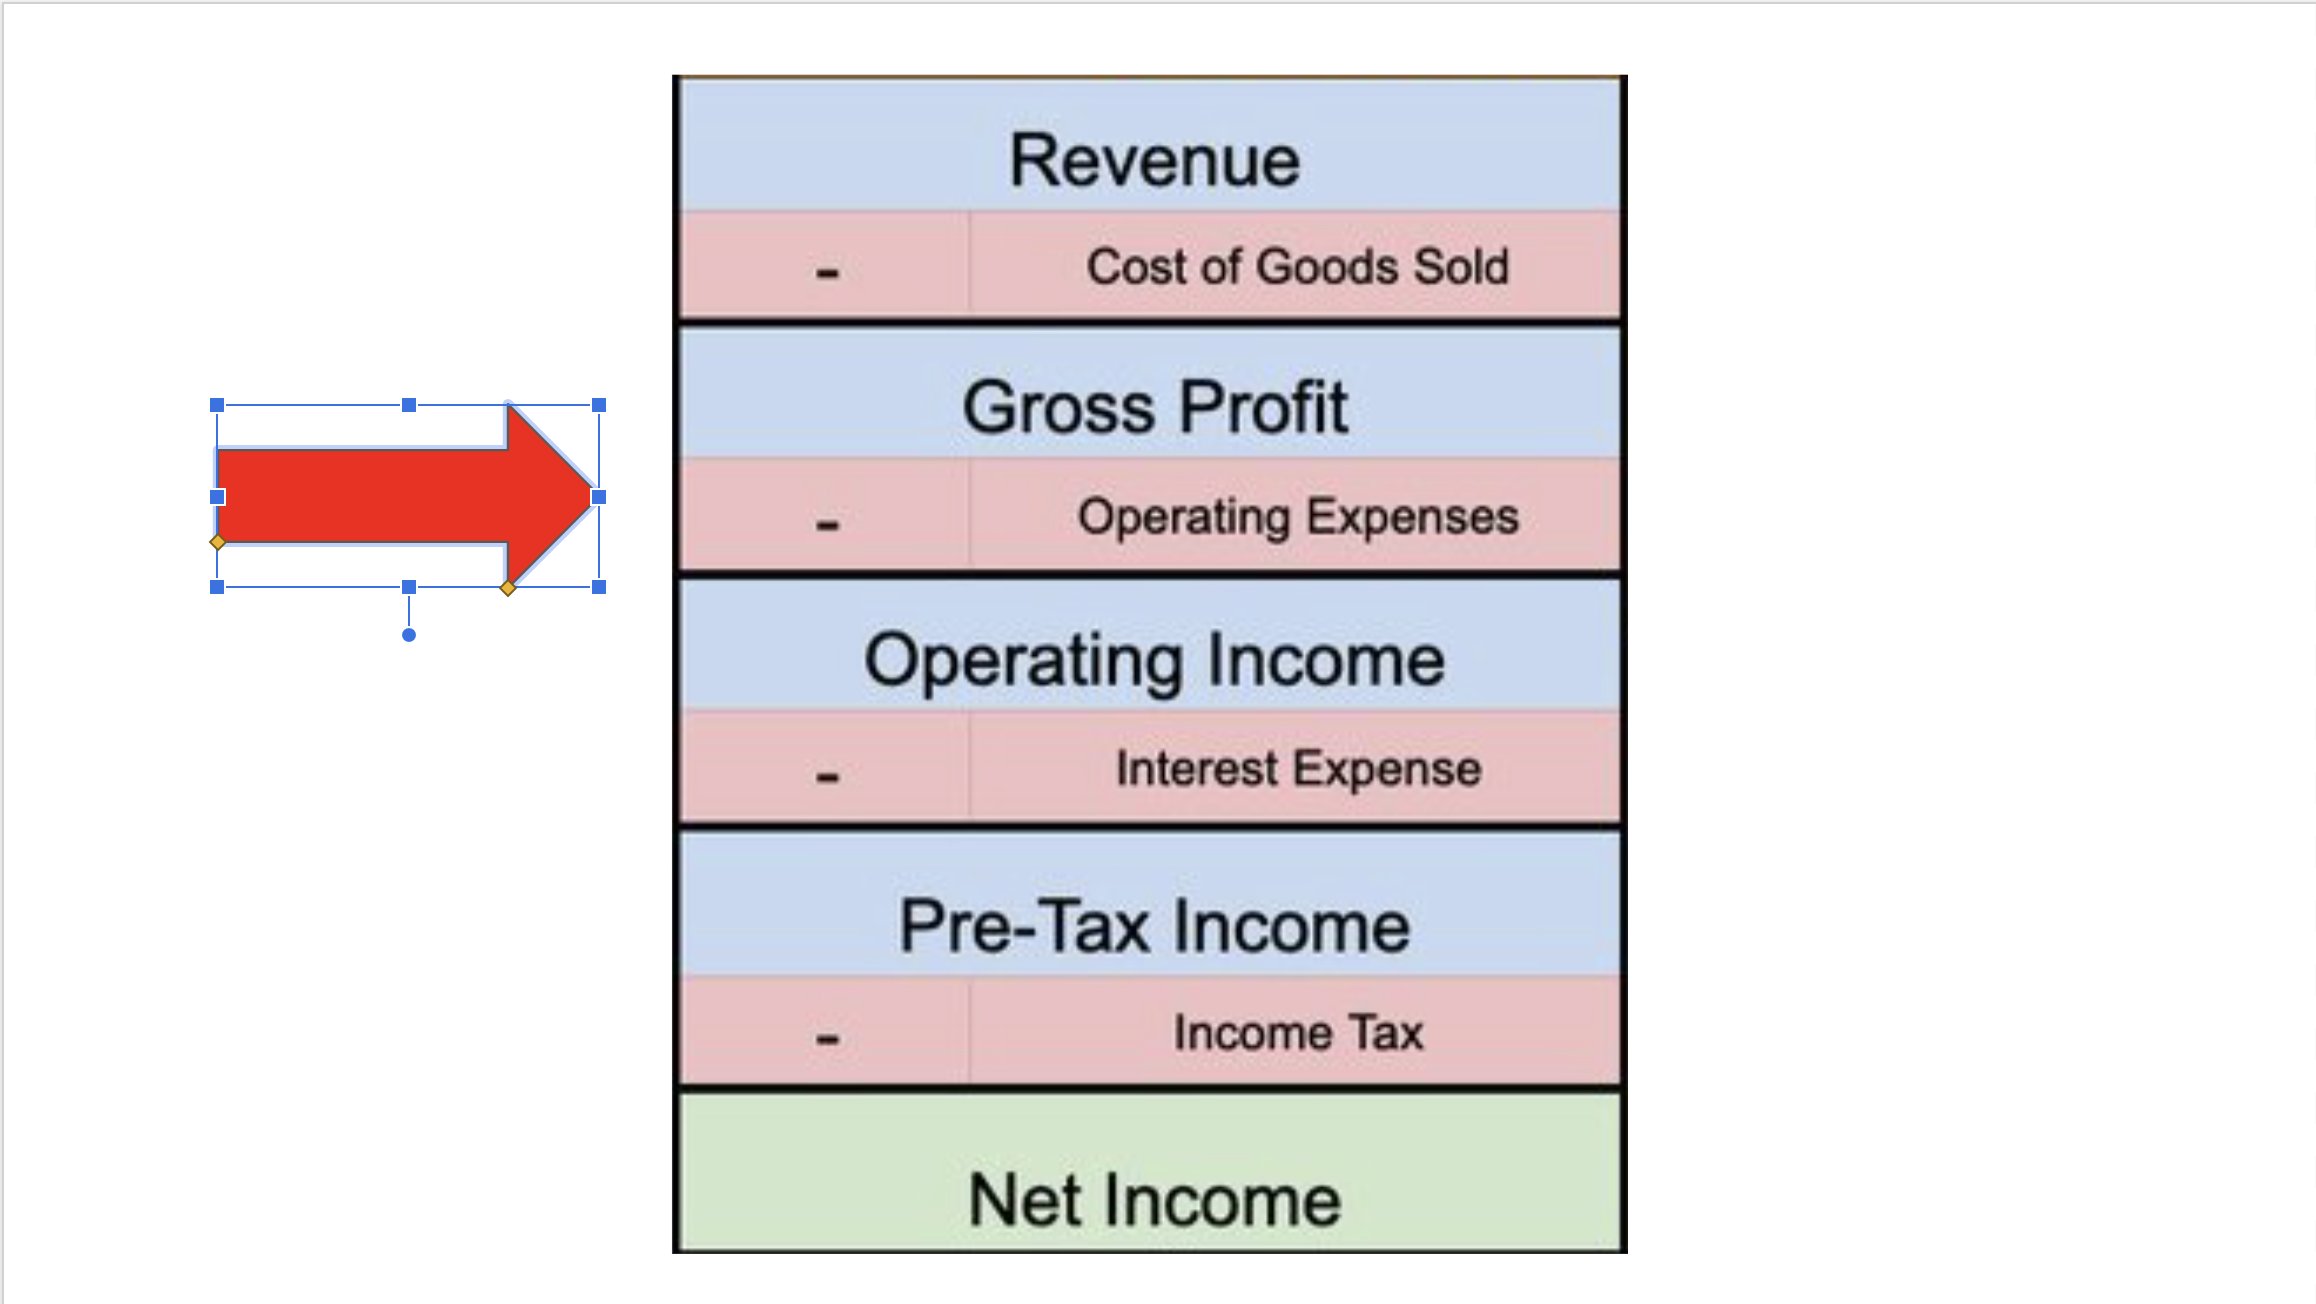
A catch all category that includes all costs to run a company’s day-to-day operations.
Some companies show detailed costs. Others lump it all together.
Common categories include:
▪️Research & Development (R&D)
▪️Sales
▪️Marketing
▪️Selling, General & Administrative (SG&A)
▪️Overhead (rent, utilities, travel, salary, bonus, stock-based compensation)
OPEX is usually a company’s largest expense.
5: Operating Income
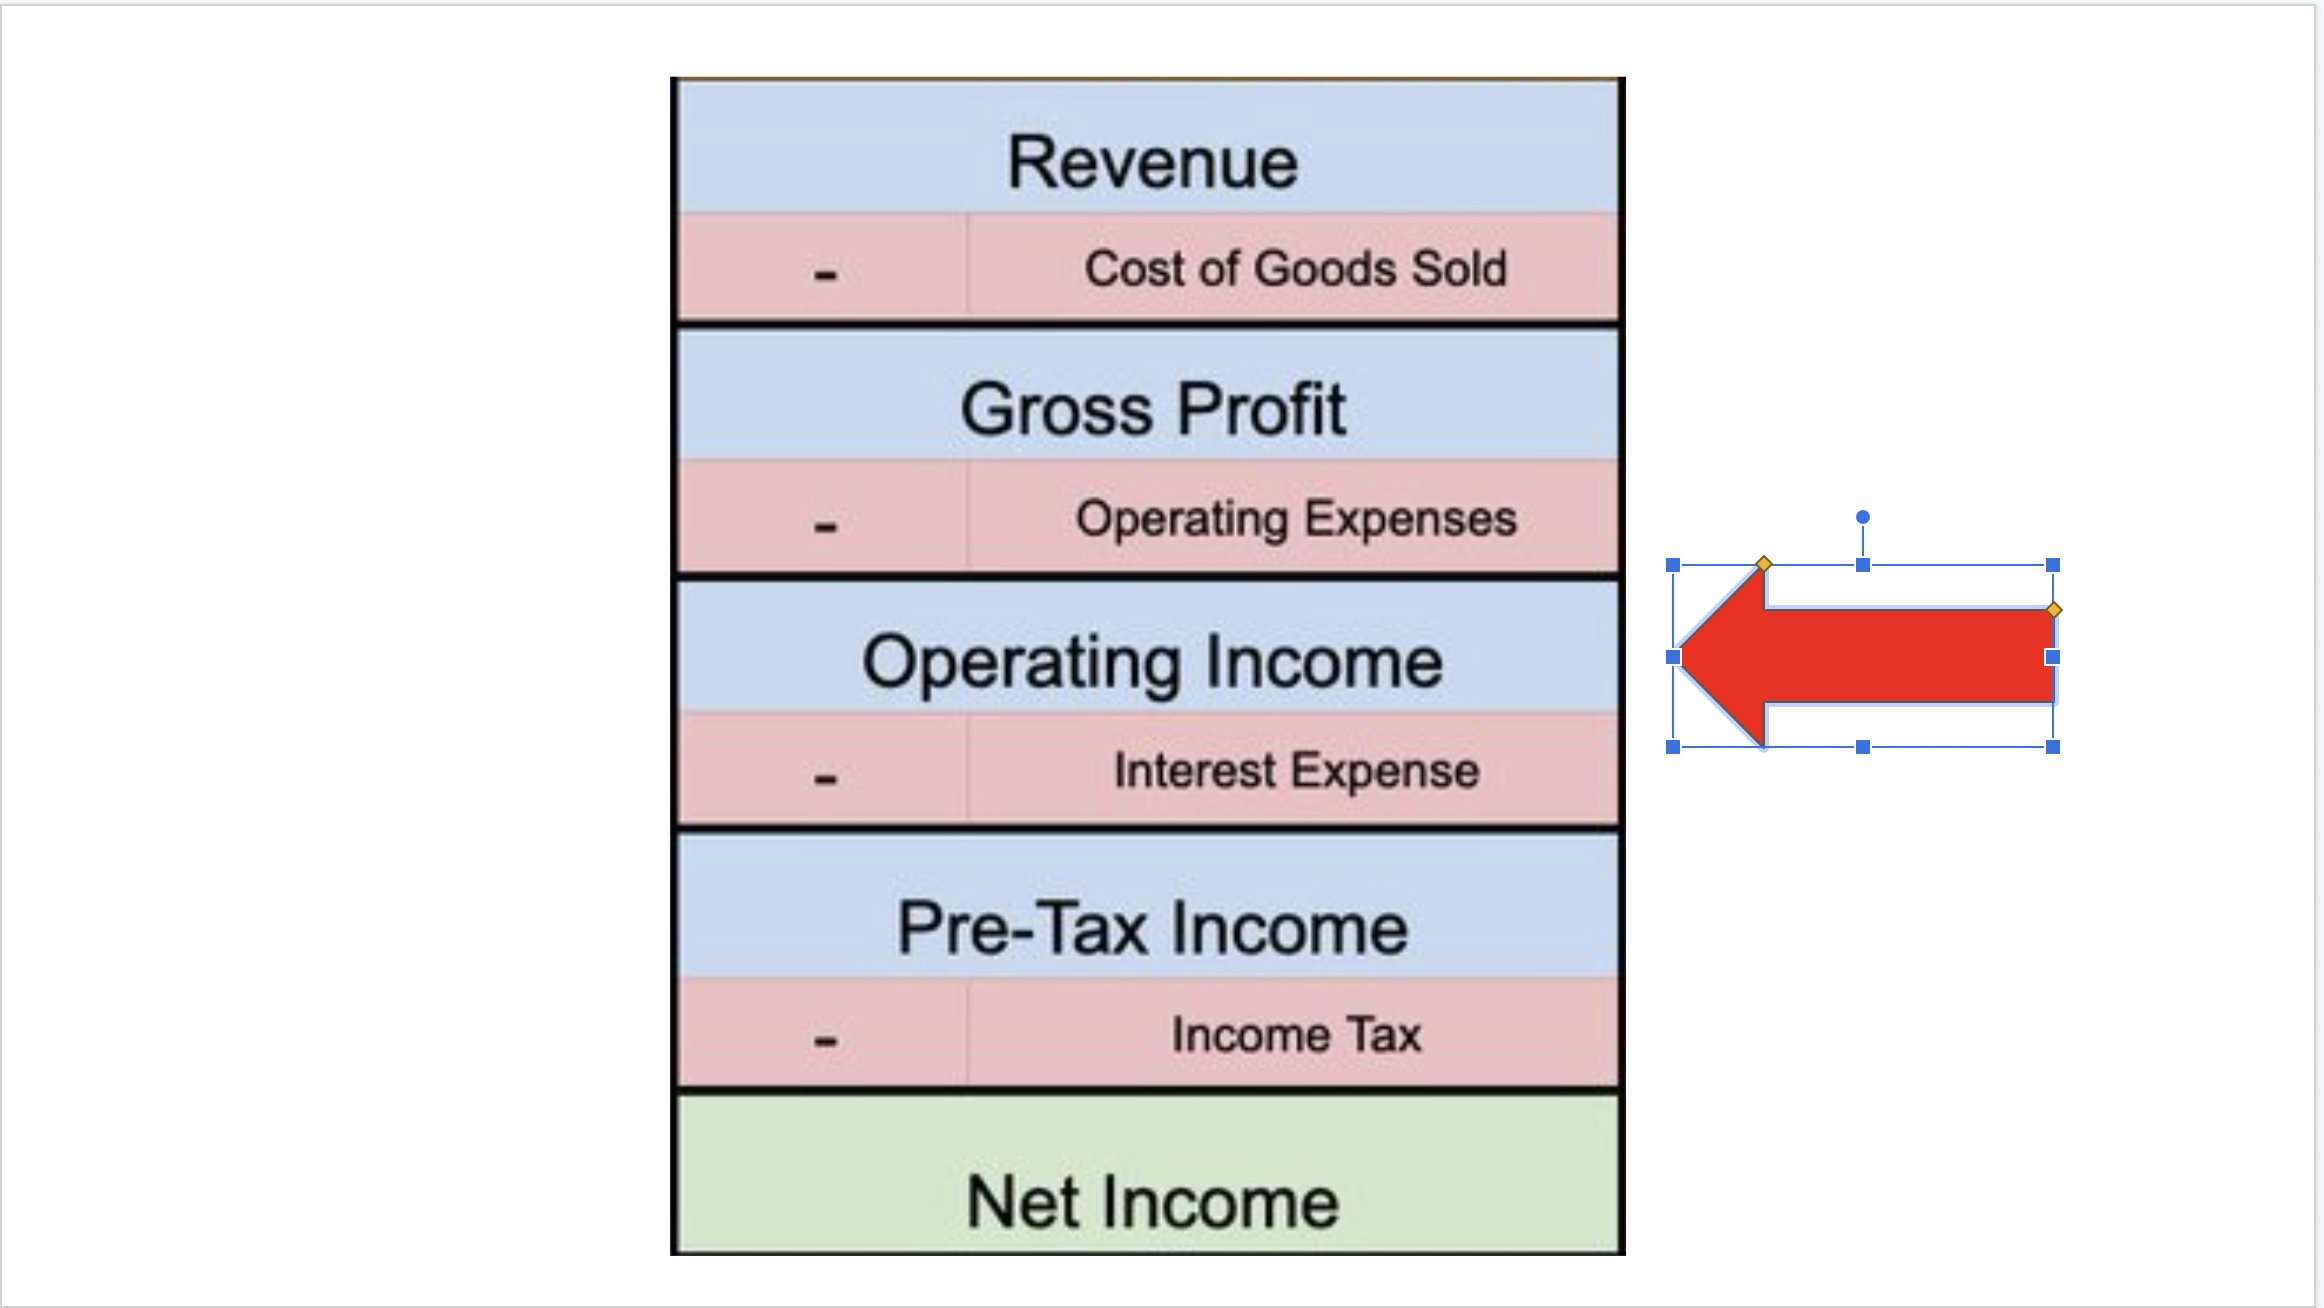
Gross Profit - OPEX
This shows how much profit a company earned from its ongoing operations.
It can also be called “EBIT”, which stands for “Earnings Before Interest and Taxes”.
6: Interest Expense
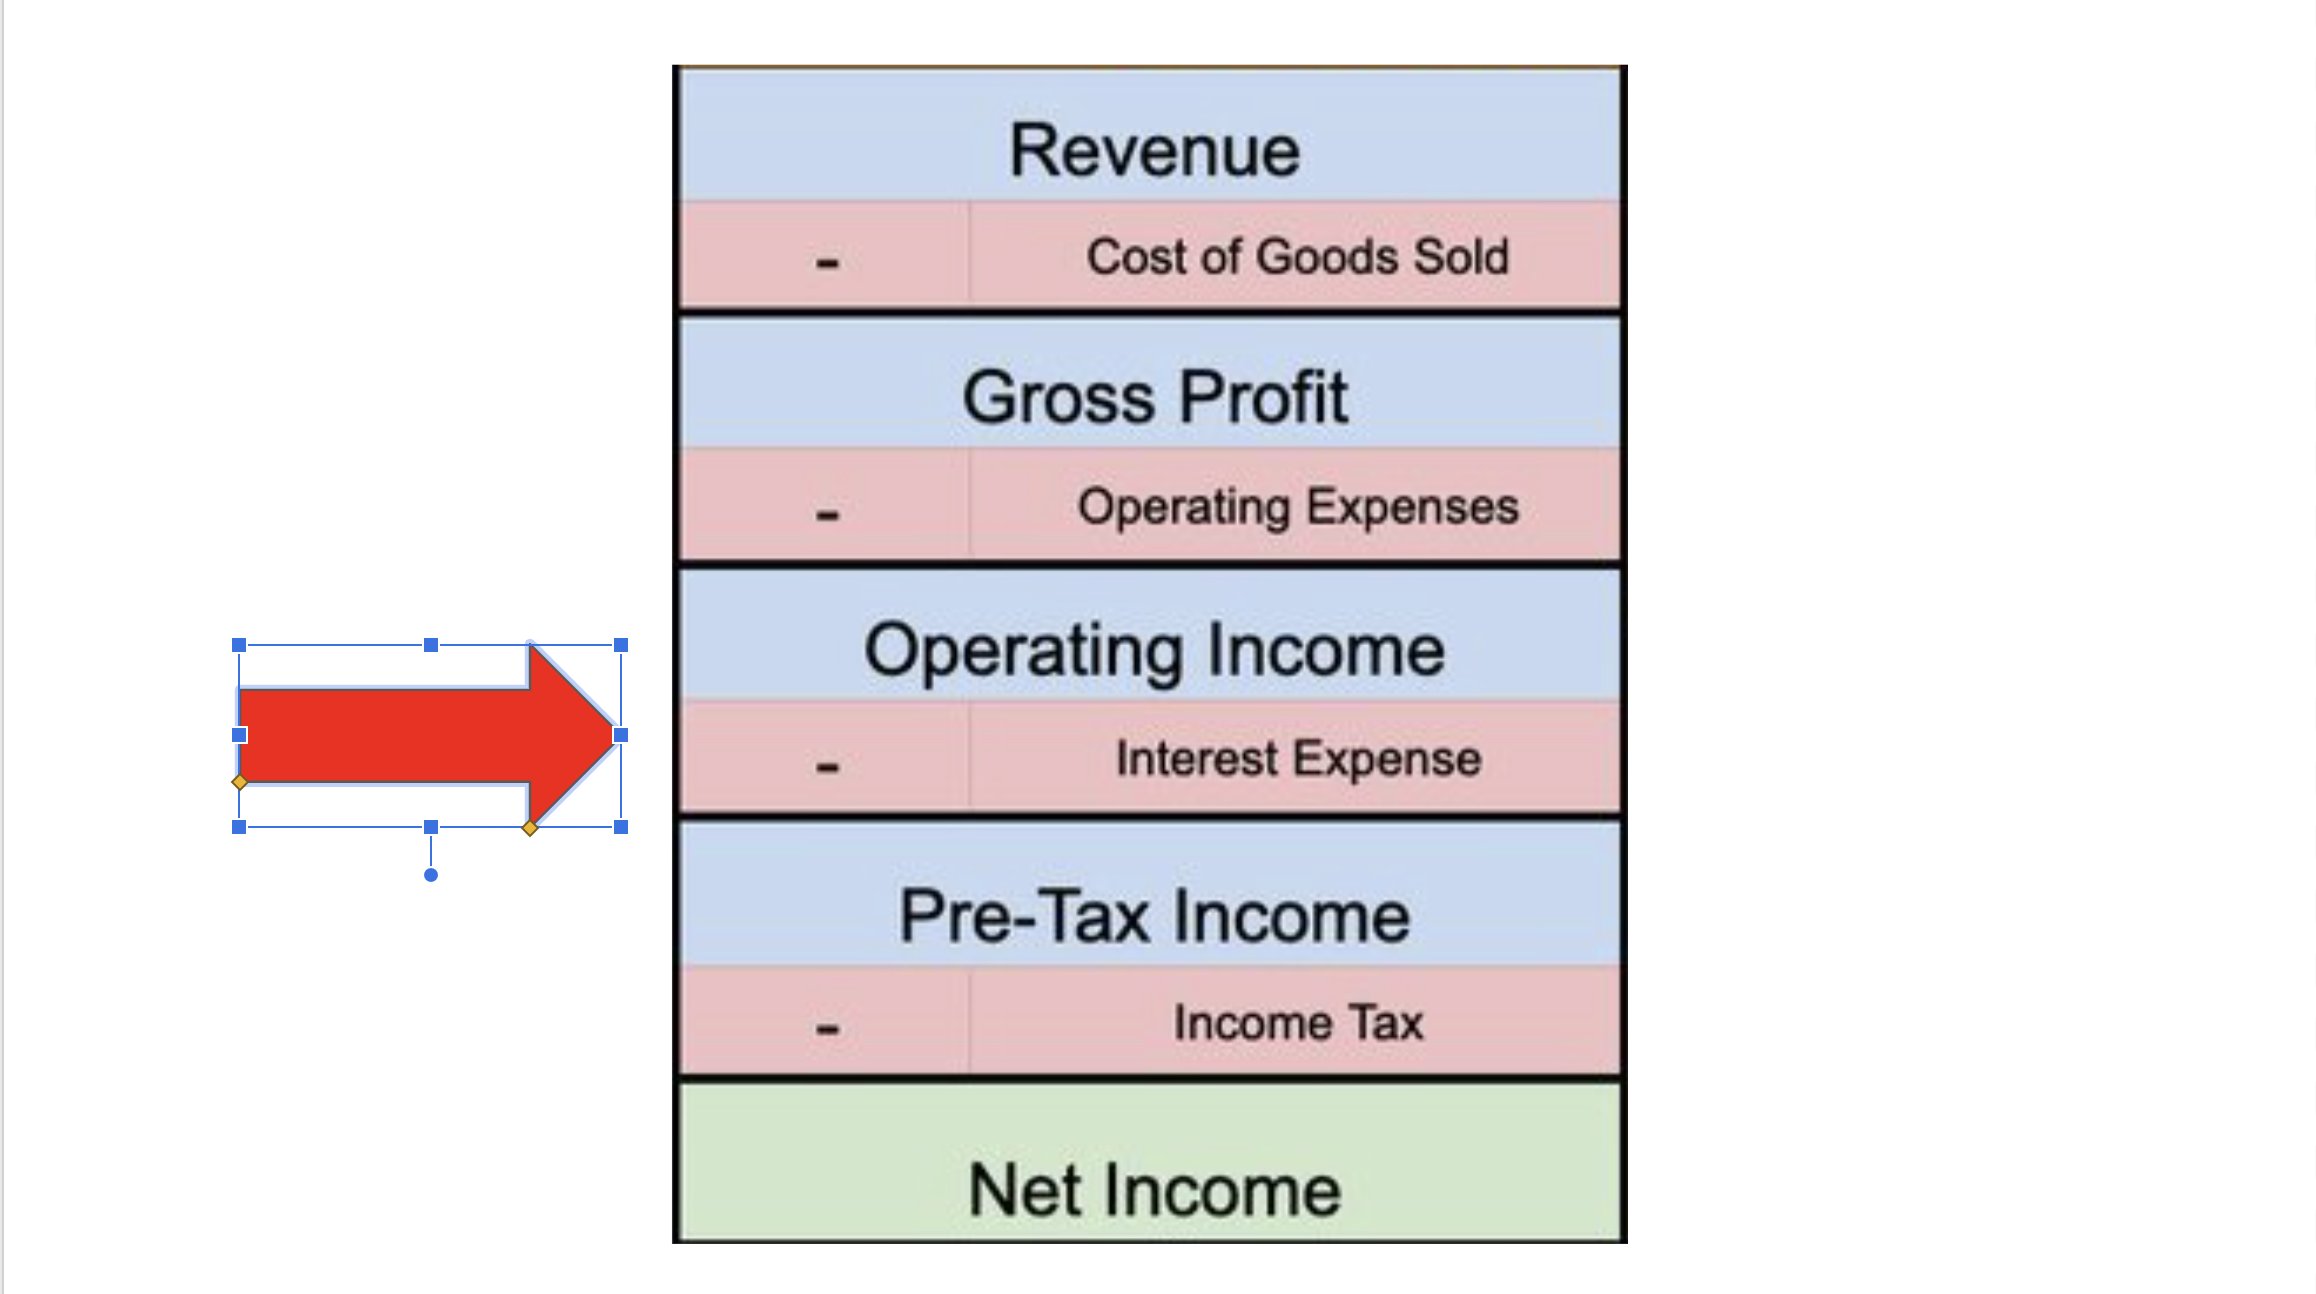
The amount of interest paid during the period.
This can also include other types of financing charges like loan origination fees.
(This can also be a positive number if the company generates more interest than it spends)
7: Pre-tax income
OPEX - Interest expense
Also called “EBT” or “Earnings
before tax"
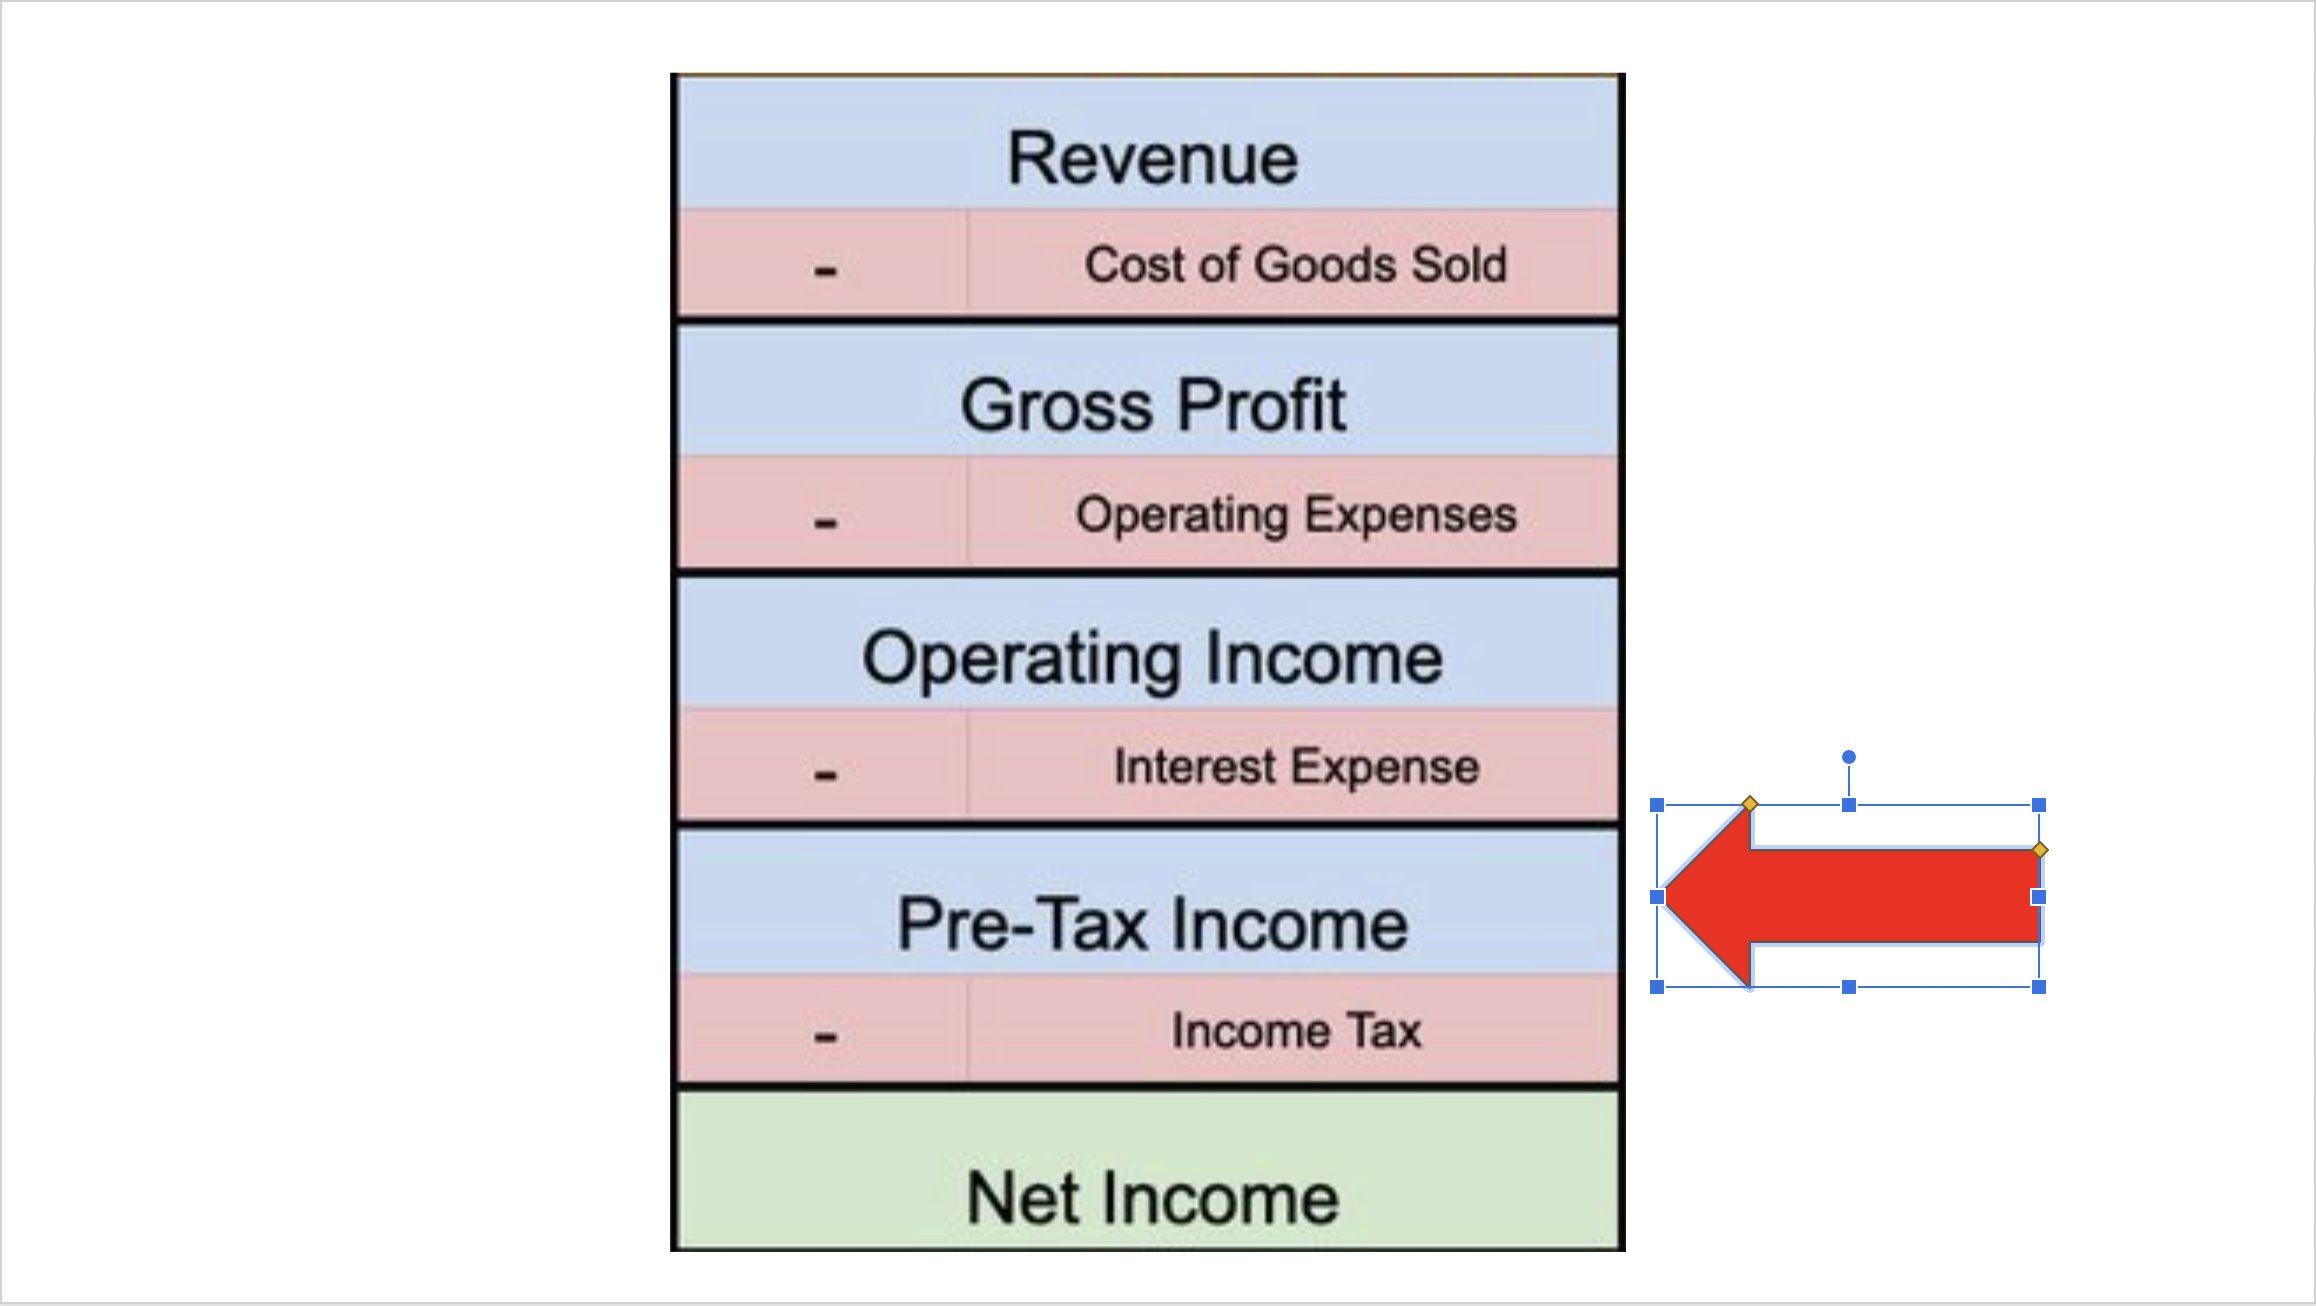
8: Income Tax Expense
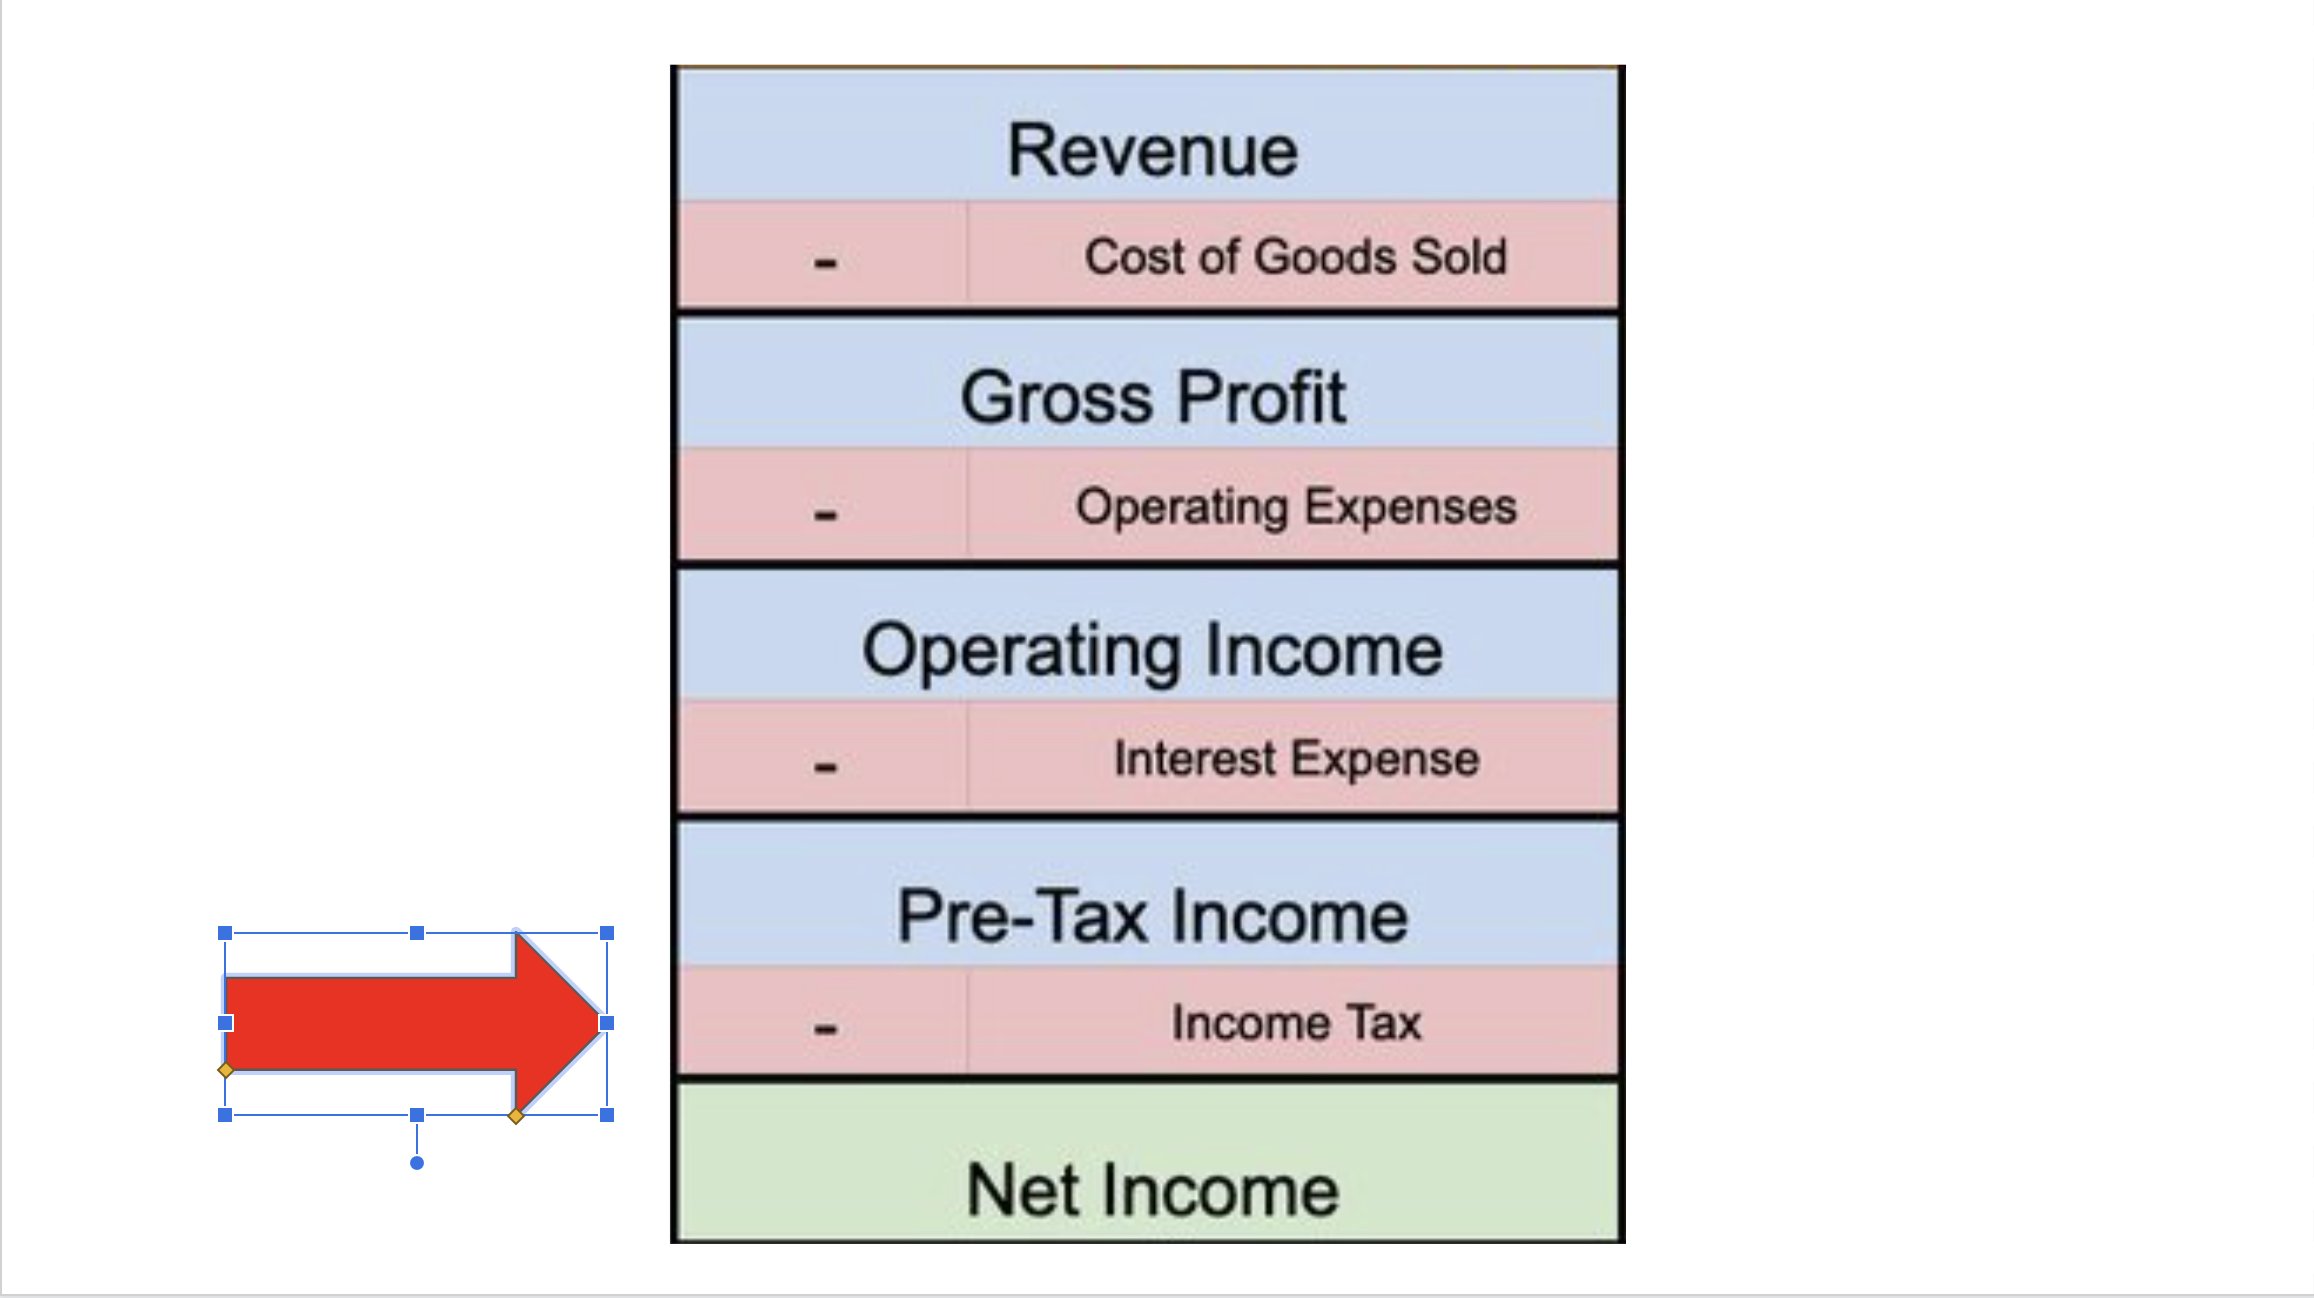
Taxes paid to central and state governments i.e GST and others. More the taxes lesser will be profits.
9: Net income
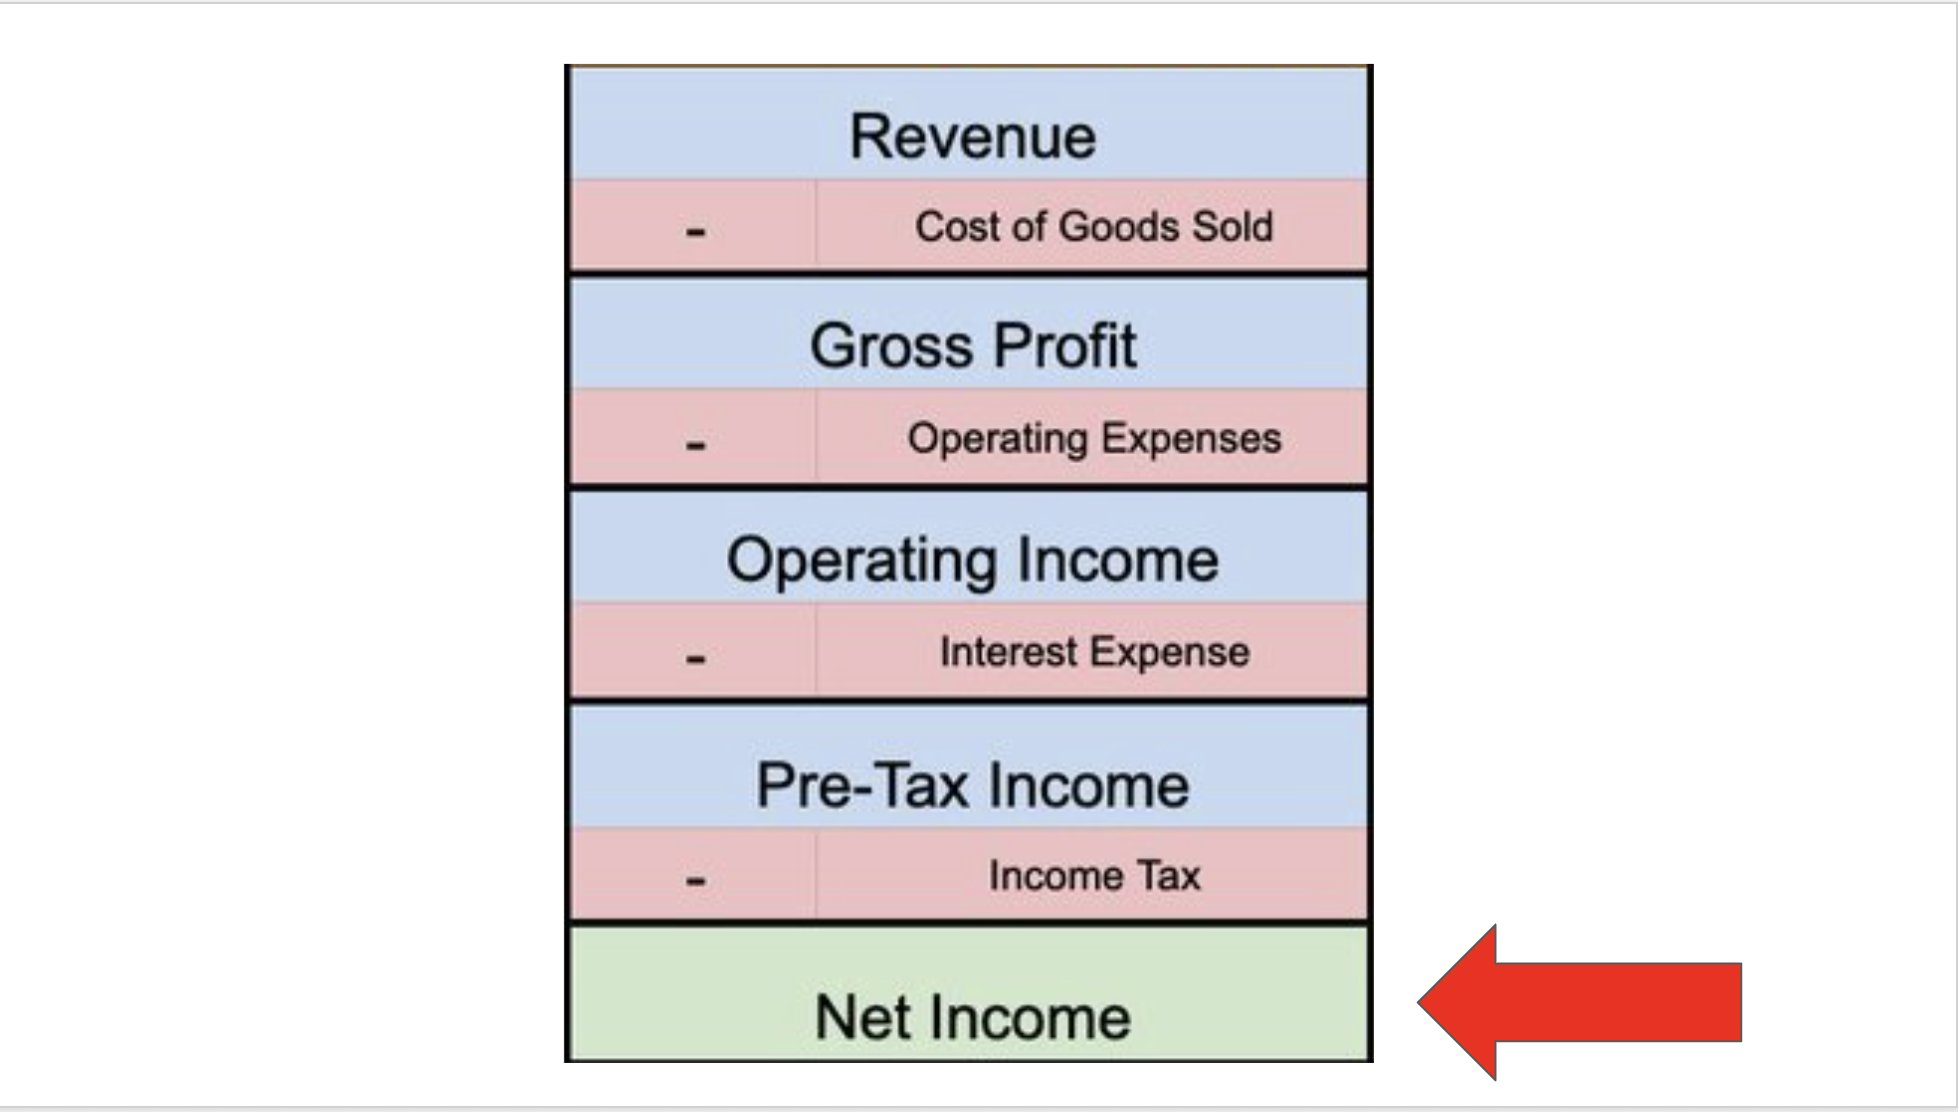
We made it to “the bottom line”, which is also called “earnings” or “profits”
If this number is positive, the business is "profitable"
If this number is negative, the business is "unprofitable"
(As always, there's nuance)
After we have found net income, we need to divvy it up!
If a company makes $10 million and it has 1 million shares outstanding, each share is entitled to $10.
$10 million / 1 million shares = $10 in "earnings per share" or “EPS”
Income statements are most useful when they are compared to a similar period.
The comparison allows you to tell if a business is growing or shrinking.
It can also be very helpful to look at each of these figures on a % of revenue basis.
My favorite numbers to check:
▪️Gross Margin
▪️Operating Margin
▪️Net Margin
Doing so allows you to compare companies of different sizes and see which direction margins are heading.
The income statement can also be useful in determining point-in-time valuations.
The most common metrics are
▪️Price-to-Sales (PS ratio)
▪️Price to EBIT
▪️Price to Earnings (P/E) ratio
These figures are usually calculated using 1-year data